Loading Forvm homepage…

Loading Forvm homepage…
In the D2C ecosystem, growth is frequently rented rather than owned. If top-line revenue doubles simply because performance marketing budgets doubled, that isn't brand equity—it's rented GMV. The moment ad spend pauses, does organic demand hold, or does revenue collapse? To move past vanity metrics, I built an econometric model evaluating 5 years of statutory consolidated Ind AS filings (FY21–FY25) across 10 listed Indian D2C companies. Using an Ordinary Least Squares (OLS) regression, I calculated the Marginal Customer Acquisition Drag (mkt): exactly how many paise of marketing it takes to capture ₹1.00 of incremental revenue.
Explore dynamic charts, regression models, sensitivity analyses, and raw data tables in a dedicated interactive view.
If you glance at the surface-level metrics on traditional financial screeners, India’s modern consumer story over the last five years looks like an unmitigated success. Between FY2021 and FY2025, direct-to-consumer darlings doubled and tripled top-line revenues, retail platforms crossed double-digit thousands of crores, and packaged foods carved out multi-state empires.
Venture capitalists and growth equity investors routinely celebrated top-line CAGR as the ultimate proxy for enterprise value.
Here is the catch: A company can double its revenue simply by doubling its digital ad budget, aggressively discounting on marketplaces, and stuffing modern trade channels. That isn't building brand equity. That is renting gross merchandise value (GMV).
When evaluating consumer businesses, an investor must ask a foundational question: When the paid marketing stops, does the customer actually come back?
To answer this, we analyzed five continuous financial years (FY2021 to FY2025) of audited, statutory consolidated Ind AS filings from CMIE Prowess across ten benchmark Indian listed consumer businesses: Trent, Vedant Fashions, Bikaji, Tata Consumer, Hindustan Unilever (HUL), Mrs. Bectors, Nykaa, Honasa Consumer (Mamaearth), Arvind Fashions, and Emami.
What We Did: Looking Beneath the Statutory Surface Most financial commentary relies on generic P&L summaries where marketing expenses are collapsed into broad buckets like "Other Expenses." If a business changes how it books trade discounts, listing fees, or shipping subsidies, traditional financial screens miss the shift entirely.
We tracked holistic Customer Acquisition Outlays, aggregating:
Advertising & Media Spend (Top-of-funnel brand campaigns)
Performance Marketing & Sales Promotions (Digital customer acquisition, marketplace commissions, rebates)
Outward Distribution & Delivery Charges (Fulfillment drag absorbed to win orders)
To evaluate these numbers without point-to-point cyclical distortion, we deployed an institutional econometric model:
Marginal Ad Drag (mkt Slope): An Ordinary Least Squares (OLS) regression isolating exactly how many paise of marketing were required to capture each new ₹1.00 of incremental revenue.
Goodness of Fit (R2): A test measuring whether top-line expansion was organically driven (R20) or mathematically handcuffed to ad budgets (R21.0).
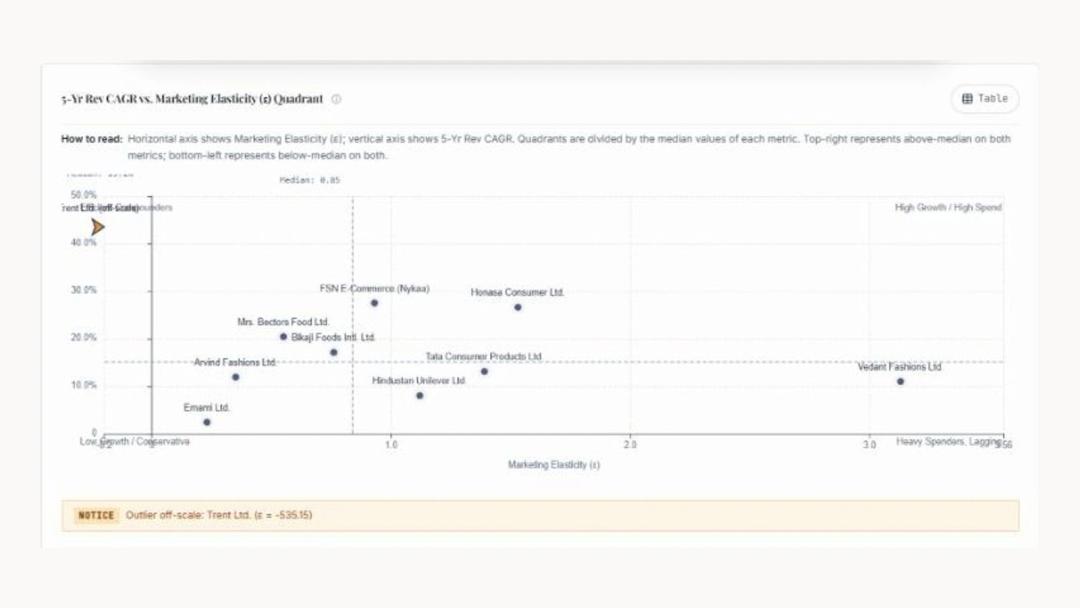
Marketing Elasticity (): A ratio showing whether scaling unlocked operating leverage (>1.0) or diminishing returns (<0.5).
What Makes This Research Distinctive? This analysis does not treat consumer startups and legacy giants as abstract ideas. It contrasts their unit economics within identical market environments:
Unmasking Accounting Camouflage: D2C companies frequently claim marketing efficiency by showing a decline in reported advertising percentages. Our analysis tracks where the spend actually migrates: when a digital brand enters modern trade or quick-commerce, pure ad spend drops, but distributor margins, listing fees, and trade rebates surge. By tracking holistic selling and distribution drag, the model prevents accounting sleights of hand.
Moving Past Top-Line Vanity: A 25% revenue CAGR is typically assigned a premium multiple. We prove that two companies with identical 25% CAGRs can sit on opposite sides of business health: one requiring zero marginal ad spend to scale, and the other bleeding 34 paise of every new rupee back into ad networks.
Econometric Precision Over Ratios: By pairing OLS slopes with R2 coupling scores, we eliminate base-year distortions and replace speculative founder narratives with statutory mathematics.
What We Found: The Four Operating Profiles The empirical evidence categorizes the Indian consumer landscape into four distinct operational profiles:
The catch? It spent virtually zero on traditional advertising.
Total marketing outlays were ₹148.6 Cr in FY21 and stood at ₹147.7 Cr in FY25.
Trent's marginal ad drag is -0.001: it captured ₹16,429 Cr of new revenue without deploying an additional rupee in media spend.
With an R2 of 0.065, Trent proved that extreme store density, aggressive inventory turnaround (a 15-day design-to-shelf cycle), and sharp value pricing can replace paid customer acquisition.
HUL & Tata Consumer: Maintained disciplined marginal drags of 8.7 paise and 5.3 paise, relying on deep, long-established distribution moats.
Vedant Fashions (Manyavar): Leveraged a 65%+ gross margin and a franchise model to generate a marketing elasticity of 3.13, proving that strong brand pricing power extracts high revenue returns from modest promotional budgets.
With an R2 of 0.991, Nykaa’s revenue and marketing spend are mathematically synchronized.
The slope is 14.7 paise per incremental rupee (rising to 20.6 paise including delivery).
Marketing elasticity is 0.93, meaning an investor expecting marketing operating leverage will find none. Because Nykaa aggregates third-party brands, marketing acts as an ongoing operational tax to defend GMV against quick-commerce and competing retail platforms.
Arvind Fashions: Spent 30.0 paise of every new rupee on customer acquisition, with marketing intensity escalating from 10.3% to 17.2%.
Emami Ltd.: Demonstrates what happens when growth stalls (2.4% CAGR over 5 years). To protect market share against direct-to-consumer and ayurvedic entrants, marketing spend increased from ₹535 Cr to ₹763 Cr. Its marginal drag hit 44.7 paise per rupee, while marketing elasticity collapsed to 0.23. Emami burned nearly 45 paise of every new rupee not to grow, but simply to keep legacy brand volumes from falling.
Major Takeaways for Investors and Founders The 15-Paise Rule: If an emerging consumer company has an incremental marketing drag exceeding 0.15 over a multi-year cycle, it does not have an organic flywheel. It is buying top-line scale rather than building consumer retention.
Channel Shifts Don't Erase CAC: Moving from D2C websites to quick-commerce (Blinkit/Zepto) or modern trade trims digital ad spend on paper, but the cost re-emerges as listing fees, platform margins, and distribution discounts. Total customer acquisition drag remains high.
The True Moat is Inventory Velocity, Not Ad Spend: Trent demonstrated that mastering supply chain turnarounds, footprint density, and organic footfall delivers compounding operating leverage that digital performance marketing cannot replicate.
Questions, alternative perspectives, useful resources, and reviews from fellow researchers and readers.
Comparing live stock market pricing across 10 Indian consumer peers reveals that standard earnings multiples routinely hide real cash payback timelines. The public market pays a steep upfront premium for asset-light top-line growth (like Honasa at 245.4x EV/FCF), while heavily discounting highly efficient, self-funding operators (like Bikaji and Bectors) that own their production—proving that market-pricing metrics rarely reflect true operational risk or free cash flow
Analyzing cash flows and reinvestment across 10 Indian consumer brands shows that high paper returns often hide real cash traps. While factory-free brands like Mamaearth rely on stretched supplier credit to post strong returns, physical-first compounders like Trent and Bikaji aggressively self-fund new stores and factories while retaining massive free cash flow—proving durable growth comes from productive assets, not accounting shortcuts.
The textbook pitch for factory-free consumer brands is that outsourcing frees up capital for superior returns, but a statutory analysis of 10 listed Indian players reveals that skipping the factory floor actually forces brands to become inventory-heavy in the warehouse—carrying nearly three times more finished stock (an average of 90 days vs. 32 days for in-house manufacturers) to satisfy third-party order minimums. While some outsourced brands like Honasa (Mamaearth) still post strong cash returns by stretching supplier payables to 190 days to fund this slow-moving stock, physical-first compounders generate durable, resilient cash without relying on vendor credit—Trent by investing heavily in storefronts that collect customer cash almost instantly, and Bikaji by running high-velocity, owned snack factories that turn inventory every three weeks. Ultimately, every consumer model pays a capital tax; the winning formula lies not in being "asset-light," but in ensuring capital isn't trapped in bloated warehouse buffers or high customer acquisition costs.


